Brake technicians are only as good as the tools they use. I have lived by this statement for a long time and it only makes sense, right? Well, what if I say the most important tool a brake technician has is his mind. The mind is a powerful tool when equipped with the right information, but can be a handicap when the information contained within is not accurate. It is my belief that the most significant challenge the brake technician faces is separating the fact from the fiction. Unfortunately, our industry has more fiction than it does fact and this creates many of the problems we encounter (See Figure 1).
For the most part, technicians are self taught. Most of what we know comes from the shop floor or from other technicians. The result of this is that while most technicians know how to R & R a part, many of them don’t know how those parts work. Much of what the average technician thinks they know about how the parts in a brake system work is based on fiction, not fact. Don’t take what I’m saying the wrong way. I believe those of us in the automotive industry have all chosen an industry that doesn’t do the best job training its people and this lack of knowledge is what creates many of our problems.
You might be wondering what’s all this got to do with this month’s topic? Well, none of the tools I am going to discuss will be of any use to you without a factual understanding of how the brake system and the components that comprise the system work. The information these tools provide will be of little to no use unless you know what it means.
Before we get into the meat of the topic, let’s review the typical diagnostic approach taken in most shops:
Customer interview;
Test drive; and
Shop-based inspection and/or diagnosis.
Let’s key in on step 3 – the inspection and diagnosis. In many cases, this part of the process involves simply a visual inspection of the various brake components and possibly measuring things such as rotor thickness, drum diameter and rotor runout. At best, this approach will allow you to spot symptoms of other things wrong in the system. Premature and uneven pad wear are two common symptoms of something else wrong in the system, as well as a rotor showing signs of over heating. Here are some other symptoms that turn up in this type of approach:
Brake drag at one or more wheels;
Cracked brake pads;
Pulsation;
Brake pull;
Brake noise; and
Low brake pedal.
This list could be carried on to completion if we had enough room. Some of these symptoms will have straightforward causes which will also be spotted during the above approach, but others will elude detection with a visual/measurement-based inspection. This is where the meat of this month’s topic starts.
What’s Available
I would like to start by outlining some of the equipment that is available to the shop or technician that allows more in-depth diagnosis of brake problems. Once we discuss what’s out there, we will briefly cover how it can be used.
Pressure Gauges
Pressure gauges (Figure 2) have been around for quite some time, but very few shops/technicians have them. Price and a lack of information on how to use the results are the two primary reasons for this. The kit is available from a couple of different manufacturers and runs around $350. The kit comes with two 3,000 psi pressure gauges equipped with memory needles, an assortment of bleeder adapters, 45 and 90 degree elbows and an adapter allowing pressure testing of some integral ABS systems.
Infrared Thermometer
This is a tool that is gaining popularity with brake technicians due to its ease of use. Most units are hand held and allow the user to point and shoot with the result being a measurement of the temperature of the object being aimed at (See Figure 3). The cost for this type of tool starts at about $100 and can go to well over $800 depending on the accuracy, range and features offered. The tool in Figure 3 is a high-end model and allows capture of the data and the ability to interface with a PC.
For the average technician, the most important feature is the range of measurement. Make sure to choose a model that offers up 1,000 degrees F, otherwise you won’t be able to handle some of the situations that arise.
Pad Clamping Plate Gauges
This tool allows you to directly measure the clamping force of a caliper (See Figure 4). The tool comes with two clamping plate assemblies and a carrying case and costs about $185.
Advanced Bleeding Tool
This tool has been around for a while and is still unknown by many technicians (See Figure 5). Those that know of it may be asking why would I list it as a brake diagnostic tool when the tool is primarily designed for bleeding?
While the tool is definitely an efficient brake bleeder and the most effective problem-solving tool when trying to remove air from a system, it has even more use to the brake technician.
Because of its flexible design, this tool’s ability to inject fluid can be used to help pinpoint blockages. This will be discussed later in the article.
Line Lock
What is he doing now might be what you’re asking when I include this tool in the list of advanced diagnostic tools, right? Well, this simple tool, when used properly, can be a very effective diagnostic tool. It can help pinpoint low pedal, pulsation, noise and pull problems. The style pictured in Figure 6 costs about $10 for a set of 4.
Skid Plate Tester
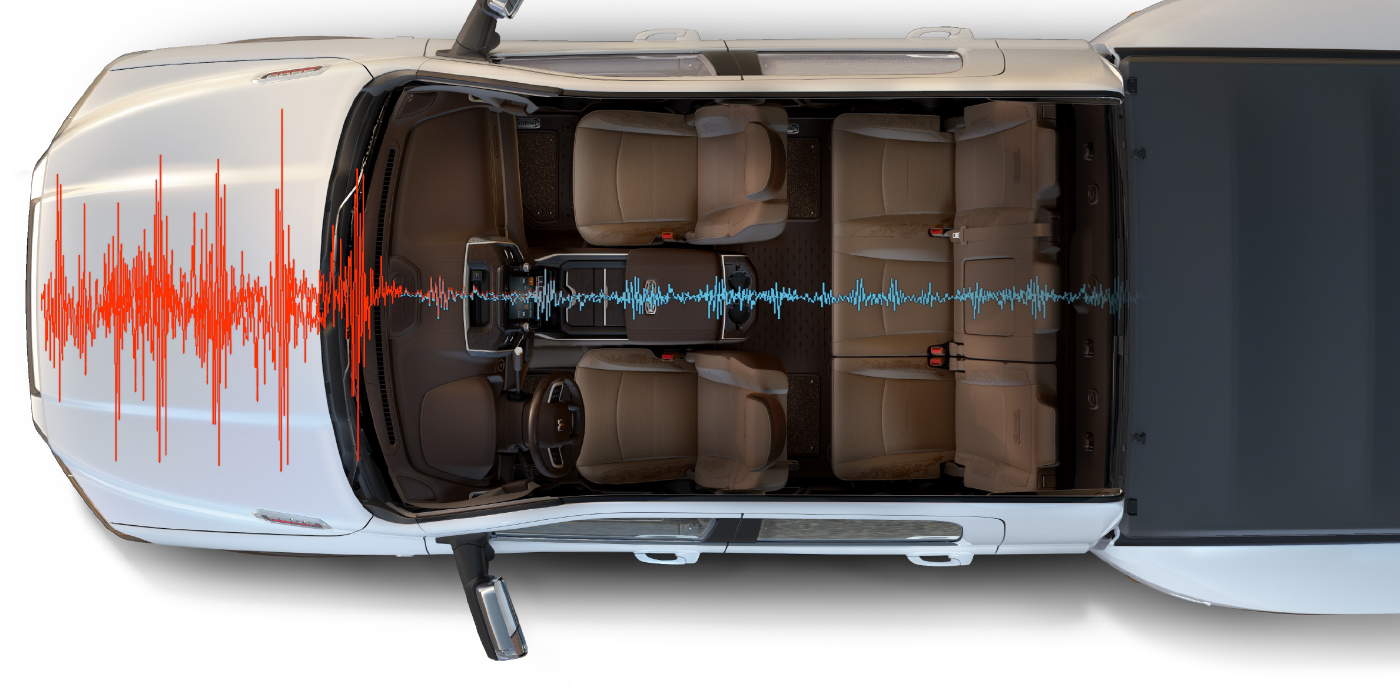
There is another tool that has been around for years, yet the average technician knows little or nothing about it. The tool is called a “Low Speed Computerized Plate Tester” (See Figure 7). This machine allows the technician to dynamically measure the vehicle’s braking balance. It measures the vehicle’s actual braking force as well as the vehicle’s dynamic weight transfer the way it occurs under high deceleration stops at higher speeds.
In a matter of minutes, you know the vehicle’s front-to-rear braking balance, front and rear axle side-to-side balances, as well as the preferred front-to-rear split based on vehicle weight and weight transfer. I have nicknamed it a “X-ray machine for the brake system.” This tool in the hands of a technician knowledgeable of the way the systems work is unstoppable. I currently own one and use it for research.
Beyond the Norm
In the past three years, I have become involved in litigation work in the product-liability area. This has necessitated the use of more advanced equipment than what is the norm for a shop or technician. I am including it to allow the reader to understand what is available and what is possible with such equipment.
Pressure Transducers – High & Low Pressure
These tools (Figure 8) perform a similar function as the analog pressure gauges discussed above. The most notable differences are the accuracy and types of use. The pressure transducer provides data to either a laptop, Vantage or other capture device. The data can be captured while the vehicle is either in a static or dynamic state.
Vericom 3000
This tool (See Figure 9) allows the measurement of a vehicle’s deceleration and stopping distance while also enabling up to 24 other inputs at the same time. It is another dynamic testing tool that allows a measurement of the vehicle’s overall stopping ability, while at the same time capturing other relevant data.
Pedal Load Cell
This tool connects to the brake pedal and allows an accurate measurement of brake input force (See Figure 10). The load cell provides a signal that can be captured through a laptop, scan tool or other capture device, such as the Vericom 3000.
String Potentiometer
Known as string pot for short (See Figure 11), this device allows accurate measurement of the brake pedal travel. The data is captured in the same way as the other devices through a laptop, Vantage or other capture device.
Using the Tools
The use of the above tools will be covered in the remainder of this article. It is not possible to cover each tool in great depth due to space limitations, but the information provided will give an overview as to the tool’s use.
Pressure Testing – Analog Gauges
To properly use the results of a pressure test, you must first understand the pressures generated during different types of braking and the function of the different brake valves used in the system.
Since most manufacturers do not publish pressure specifications, it is necessary to use generic values in many cases. Typically, the hydraulic pressures generated during light to normal braking will be from 300 psi to 500 psi.
Panic braking is generally considered to start at about 600 psi. The proportioning valve will start to limit pressure to the rear brakes at this time. If a full panic stop is taking place, the proportioning valve will limit the rear brake pressure to about 800 psi while the front brakes will climb to between 1,500 psi to 2,000 psi.
The numbers presented here are averages based on many tests performed on different vehicles. The main thing to understand is the front-to-rear pressures should be EQUAL up to a point (usually around 500-600 psi) and then the rears should taper off as the front’s continue to climb.
Two common methods of pressure testing are, checking the front to rear brake pressures and checking an axle’s side to side pressures. The uses of each of these tests is explained below:
Checking front-to-rear pressure:
Performing a front-to-rear pressure test can be done to help diagnose the following conditions:
Proportioning valve function – usually done to diagnose the cause of rear wheel lockup during panic braking or possibly a proportioning valve causing a restriction (won’t reopen after release).
Premature front brake pad wear – pressure tests are used to determine if a lack of rear braking is related to the cause of the front pad wear.
Height sensitive control valve diagnosis or adjustment – these valves usually incorporate pressure tests in the adjustment procedure and can be diagnosed using pressure gauges.
Figure 12 shows the results of a typical front-to-rear pressure check. The difference in pressures indicates normal proportioning valve function.
Checking side-to-side pressures:
Side-to-side pressure tests are performed to help diagnose the following conditions/symptoms;
Brake pull – different hydraulic pressures results in different clamping forces and can result in a pull; and
Side-to-side pad wear differences – if the pads on one side of an axle are wearing faster than the pads on the opposite side.
The results of a typical side-to-side pressure test are shown in Figure 13. This test shows a side-to-side difference which would indicate a restriction to the lower side. Keep in mind, a brake system can’t generate too much pressure so when looking at side-to-side readings, the low side will usually be the problem side indicating a restriction between the master and the wheel.
Another thing to keep in mind is how much side-to-side difference is acceptable? There is no easy answer to this question. Theoretically, the pressures should be identical, but you will find this is not always the case. What you don’t want to do is chase what I call “ghosts” or non-problems.
Performing a front-to-rear pressure test:
Connect the gauges using the manufacturer’s instructions. Most pressure gauges connect to the caliper or wheel cylinder’s bleeder screw hole (See Figure 14). Make sure to properly bleed each gauge hose.
Place the gauge’s memory needles on zero.
Start the vehicle. Apply the brake first using light to moderate force as if making a normal stop. Note the pressure readings. Under this pedal force, the front pressures should not be more than 500 psi in most vehicles. Compare the front and rear pressure readings. At this pedal force they should be equal or near equal. If equal, continue to next step. If there is a large difference with the rears being substantially lower than the fronts, there is a potential problem. The list of possible causes will depend on the system configuration. The list will include:
Restricted proportioning valve;
Restricted brake hose to the wheel or axle;
Restricted steel brake line;
Out of adjustment or restricted height-sensitive control valve; and
Restriction in ABS modulator.
Front and rear pressures equal at light to normal pedal force – With vehicle running, increase pedal force to duplicate panic stop. Front pressure should climb to between 1,200 psi and 2,000 psi. Rear pressure should match front pressure to about 500-600 psi and then stop somewhere short of 1,000 psi.
The key here is rear pressure should fall off dramatically from front pressure when front pressure climbs to over 1,000 psi. This is an indication of proper proportioning valve operation. If rear pressures climb at same rate, and to the same level as fronts, go to next step.
Front and rear pressure equal at panic stop pedal force – This indicates a non-functioning mechanical proportioning valve or an out of adjustment height-sensitive proportioning valve. NOTE: Front-to-rear pressure testing on vehicles equipped with Electronic Brake Distribution (EBD) or Dynamic Rear Proportioning (DRP) should be equal regardless of the base pressure. Rear pressure is limited through the modulator and can only be checked in a dynamic state.
Caliper Clamping Force
In most cases, the clamping force gauges are installed in place of the inner brake pad (See Figure 15). Once in place the caliper pistons are pumped out to take up the gap and then clamping pressure is measured.
This is not a direct measure of the pressure in the brake system. It is the amount of force being generated by the caliper pistons. If you had the caliper piston’s diameter, you could use the result of this test to calculate the pressure in the brake system.
The clamping force of each caliper should be roughly equal. There is not much in the way of guidelines to say how much side-to-side difference is acceptable, so you have to use common sense. Again, theoretically, the clamping force should be equal, but real-world results will not always show this.
A rule of thumb I follow is unless the side-to-side difference can be associated with a symptom, such as premature pad wear or brake pull, don’t worry about it.
These tools will directly help identify sticking caliper pistons and indirectly help identify hydraulic restrictions.
Measuring Temperatures using an Infrared Thermometer
TIn most cases, these hand held thermometers are easy to use, just point and shoot. Most units have a digital display that provides the temperature of the component being measured. The units generally have a maximum accurate distance so they can’t be too far from the object being measured or the accuracy of the reading will be affected. Some of the advanced units actually need to have the type of material entered in to provide accurate measurements. Make sure to read the operating instructions for the unit being used.
The biggest challenge in using one of these tools is what to do with the information. The information provided by these tools can be even more vague or elusive than the hydraulic and clamping pressure readings discussed earlier. Here are some of the reasons why:
No specifications provided;
No way of knowing how much front-to-rear temperatures should vary;
On side-to-side differences, it can be difficult to determine which reading is the problem; and
Some side-to-side differences can be expected under normal brake operation.
Here are some pointers to follow when taking temperature measurements:
Take the measurements close to the object being measured and as soon after the test drive as possible;
Compare side-to-side readings. Look for symptoms of excessive heat such as bluing of the rotor. This will help determine if a wheel is running too hot or too cold;
Excessive heat on one wheel can be caused by a wheel being overworked, a lack of release or an excessive side-to-side difference in rotor thickness;
Don’t always condemn the high-side reading; it is possible that the low side isn’t working enough; and
Remember that excessive heat is a symptom of something else wrong in the system.
Figures 16 to 18 show some examples of temperature readings and their related causes. I am currently working on evolving this test technique so the information gathered will have more meaning. You can look for this in a future article.
Brake Fluid Injection
Since the advanced bleeding tool is a hand-held fluid pump, it can be used as an affective method of determining if a hydraulic restriction is present. At rest, each of the wheel brakes should be connected to the master cylinder reservoir through the open vent ports in both hydraulic circuits.
This fluid path is necessary to allow for the expansion of the brake fluid that takes place during braking due to heat. If a restriction exists in any of the wheel brake circuits, it can cause a lack of release or a lack of braking at that wheel.
The tool can be used to pump fluid into either end of the system to determine the ease of fluid flow. This would generally be done on the calipers and wheel cylinders.
Since no specifications are available, common sense and a comparison from side-to-side is used to determine if a problem is present. If the trigger gets hard when using slow steady strokes, it is an indicator of a restriction in that circuit. The restriction can be traced down by working your way up through each component, while checking at both the inlet and outlet (See Figure 19).
Line Lock
The line lock is a simple yet very effective tool for the brake technician (Figure 20). Line locks can be used to find the source of a number of different brake problems. The key benefit of a line lock is that it allows the technician to isolate different parts of the brake system. Isolating the wheel brakes can be useful in determining the location of a low pedal problem, brake noise, pulsation and some brake pull issues.
Diagnosing the cause of a low brake pedal can be done with a line lock test. Installing line locks on each of the system’s brake hoses will allow you to break the brake system down into smaller parts allowing a more accurate diagnosis (Figure 21). Here are some pointers:
Make sure the wheel brakes are isolated by applying the brake with the vehicle running and checking to see if the wheels turn.
Perform the test with the vehicle running. Apply the brake and release each line lock while noting the amount of pedal drop.
The line lock test will not tell you what is wrong, only where it is wrong.
Line locks can be used to identify where a brake noise is coming from, a pulsation or some pull problems by isolating one wheel or axle and test driving the vehicle. This should only be done in an isolated environment such as a parking lot for safety reasons. Never drive a vehicle on a public road with a line lock installed.
Some brake noise problems can be difficult to pinpoint. Isolating different parts of the system and then driving the vehicle to see if the noise is eliminated will help pinpoint where the problem is coming from. The same is true for pulsations. If you have a reoccurring pulsation, wouldn’t it be useful to know it is always coming from one wheel?
Dynamic Measurement of the Brake System – Skid Plate Tester
One of the most important aspects of proper brake system operation involves the braking balance or bias of the system. There are two types of balance that are of concern to the brake technician – front-to-rear and side-to-side. The front-to-rear balance of a brake system is designed into the brake system and is determined by the size and type of the brakes at each axle, the weight distribution of the vehicle and the brake valving. Side-to-side balance of both front and rear axles should be equal regardless of the type of brake system.
This should raise two questions – what should a vehicle’s front-to-rear balance be and how to determine if it is correct.
The answer to the first question isn’t as direct as you would hope. There is no specification chart you or I have access to that would provide this information. The best we can do is estimate. The two biggest contributing factors that determine a vehicle’s front-to-rear braking balance is the amount of weight over each axle and the size of the wheel brakes. We have all heard and used numbers like 60/40, 70/30 and 80/20 to describe this balance. The only issue becomes were we using the correct ratio? Well, the skid plate tester can help provide the answer to this important question.
The test is easy to perform. A vehicle is pulled onto the skid plate tester at about 4 to 7 mph. The brakes are applied in an aggressive stop, but not to a point to lock the wheels up. The goal is to use as much of the plate as possible and pass a minimum deceleration value.
Once the stop has been made, the vehicle is backed up over the weight scales and then the results are displayed on the screen (See Figure 22). At first, the test result may seem overwhelming and busy. It is easier to understand if you look at it one portion at a time. Figure 23 shows the left-hand portion of the test result. This is a graph of brake force over time. Each line represents one of the vehicle’s wheels. The dark blue line is the right front, light blue is the left front, orange is the left rear and yellow is the right rear. Just below the graph are the actual braking force results.
The software takes the readings from the left hand of the screen and translates them into an easier-to-understand format.
This is shown on the right-hand part of the screen (see Figure 24). The top right part of the screen shows the front axle side-to-side balance results. In this case, the left front’s 865 lbs. is 11.4 percent less than the right front’s 976 lbs. (Figure 24a).
The next bar graph down shows the rear axle balance results. In this case, the 241 lbs. from the left rear is 10.7 percent less than the right rear’s 270 lbs. (Figure 24b). The small squares to either side of center of the front and rear axle graphs are the pass/fail limits for each axle.
The third bar graph shows the front-to-rear balance. In the example shown, the front brakes produced 78.3 percent of this vehicle’s stop during the test. The delta (small triangle) below the front-to-rear graph indicates the calculated ideal front-to-rear balance based on the vehicle’s weight and the dynamic weight transfer that took place during the test. The squares to either end of the front-to-rear balance graph are the minimum and maximum allowance for front braking. The remaining portion of the screen shows the vehicle’s deceleration, velocity and weight.
NOTE: The screen shots shown are from an older version of the software. The newest software’s screen is slightly different.
This information in the hands of a technician knowledgeable in the operation of the brake system and its components is a very powerful tool. While the machine will not “tell” you what is wrong with the brakes, it will tell you where it is wrong. I have an extensive amount of experience with this machine and can personally say this machine will find problems no amount of test driving or shop-based diagnosis will ever find.
Getting back to the front-to-rear balance, based upon the many tests I have conducted over the years, the best numbers to use are:
Passenger cars & SUVs with front-to-rear split hydraulic systems: 60/40.
Passenger cars with diagonal split hydraulic systems: 80/20;
Pickup truck with front-to-rear split hydraulic systems: 70/30; and
SUV with diagonal split hydraulic systems: 60/40.
I want to stress to you that these numbers are averages and there are no specifications you and I can get our hands on. In basic terms, the vehicle’s weight over each axle is a key factor along with the weight transfer that takes place during a stop and the size and type of the wheel brakes in determining a vehicle’s front-to-rear brake balance.
Measuring Pressure Electronically
I’ll keep this section short, but hopefully interesting. Pressure transducers can allow measurement of the hydraulic system pressures not only in a static condition, but also when the vehicle is being driven. Figures 25 and 26 show graphs from two such tests. Figure 25 is a pressure test during a panic stop for a light truck. Notice how the front and rear pressures stay the same until about 300 psi and then the rear pressure climbs at a slower rate and caps off about 800 psi. This is showing proper proportioning valve function. The split point of the proportioning valve is lower than the 600 psi I mentioned earlier due the light rear end.
Figure 26 shows a pressure reading during a normal stop on a vehicle experiencing high-speed pulsation. It is easy to see where the pulsation is coming from when you look at how the pressure is modulating during the stop.
Low pressure transducers can be used to measure for drag and other hydraulic restrictions.
The graph in Figure 27 shows the amount of residual pressure necessary to cause noticeable drag on a typical floating caliper disc brake. Two and a half psi was all that was necessary to get the brake pads where they don’t belong – against the rotors!
Vericom 3000
With this tool I can not only capture the stopping distance of a vehicle and the corresponding deceleration, but I can also pipe in a number of other different sensors such as pressure transducers, pedal load cell, string pot and numerous others. The data is captured during the entire stop event and provides information such as that shown in Figure 28. Figure 28 is an ABS stop on a three-channel ABS system.
Pedal Load Cell & String POT
These devices are usually used in conjunction with other sensors to provide a consistent way to control input force and measure pedal travel. They are mounted as shown in Figure 11 and the outputs are piped into the data capture device.
In Closing
Providing you can decipher it, the equipment discussed in this article can provide a wealth of information. The lack of specifications or guidelines on what the information means, places the burden on the shoulders of the brake technician. Are your shoulders ready for the extra weight?